Stackform
Personal Project · iOS App · 2026
Problem
When I started investing tracking stock performance over time was often using cluttered apps that prioritize trading over reflection. Most tools show you today's numbers, but don't help you see patterns in how your portfolio has performed across days, months, or years. And the apps that do offer historical views tend to be overwhelming, requiring accounts and sharing your financial data with third parties.
Goal
Create a focused, privacy-first iOS app that visualizes stock performance as an intuitive grid. Making it easy to spot trends at a glance without the noise of a full brokerage platform. Keep it simple: no accounts, no cloud sync, no ads.
Solution
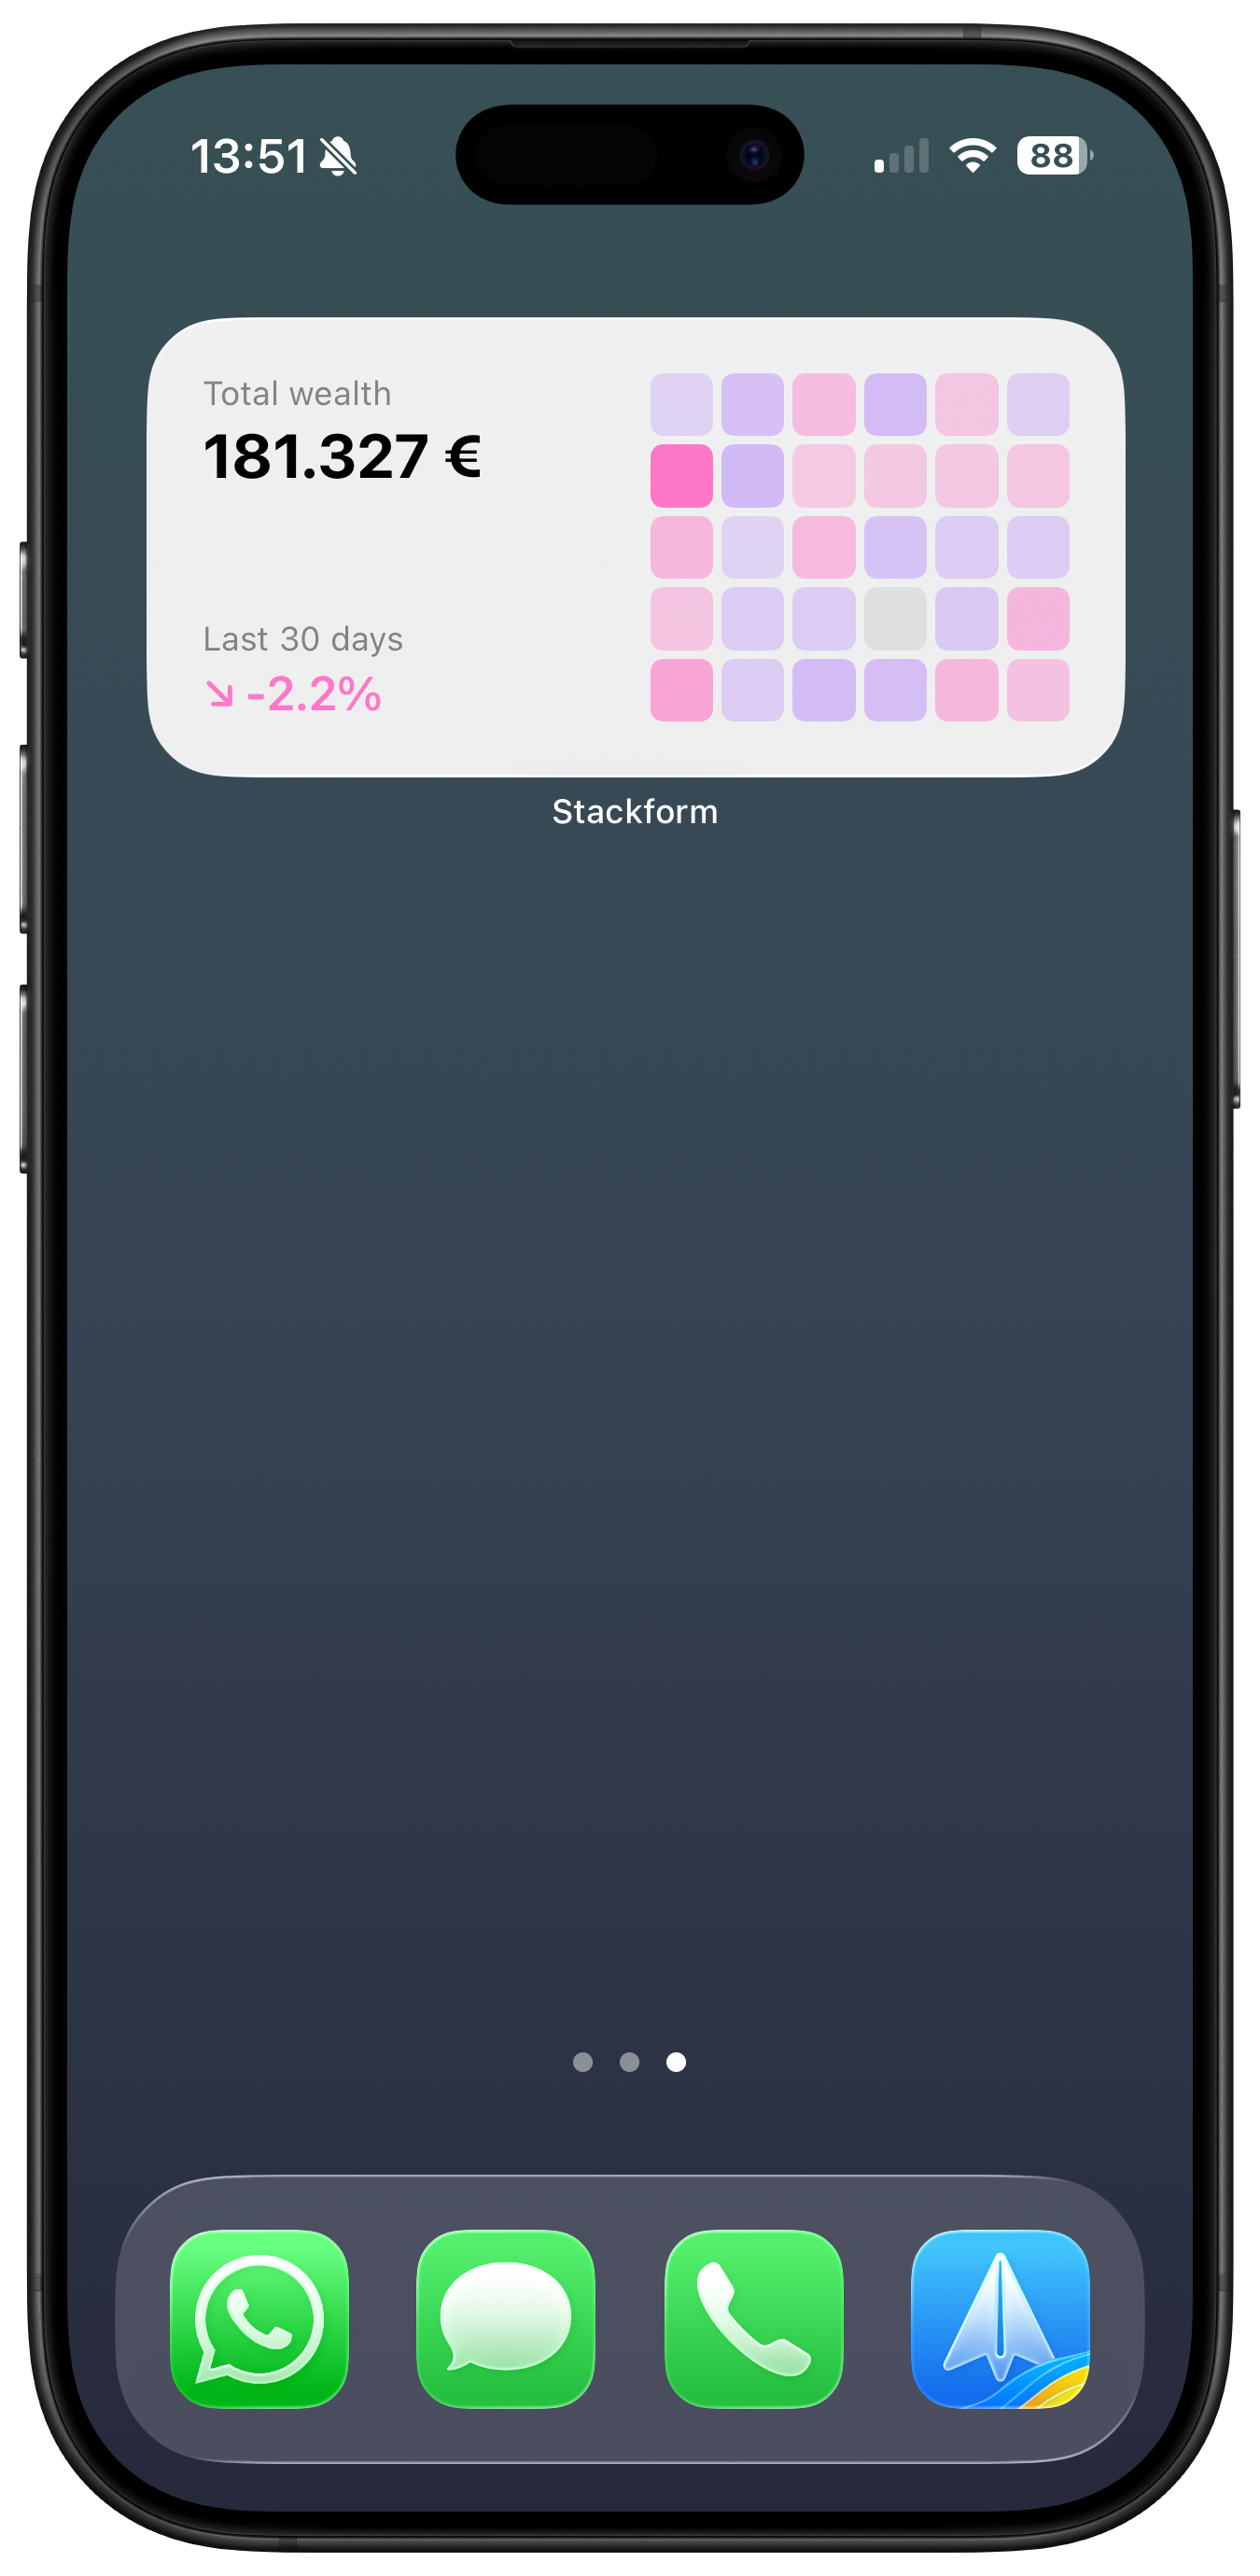
Stackform displays performance data as a waffle-style heatmap grid, where each cell represents a time period colored by gain or loss intensity. Users can toggle between daily, monthly, and yearly views, with ranges from 30 days to their complete history.
Built with SwiftUI , the app fetches market data from the Twelve Data API and caches results locally with a rolling 24-hour rate limit to keep the free tier sustainable. All data persists on-device via UserDefaults, no backend, no accounts.
Optional tips via StoreKit 2 let users support development without unlocking features. Keeping monetization separate from functionality. Widgets built with WidgetKit bring the waffle grid to the home screen for at a glance portfolio health.